Keep operational evidence attached to the work.
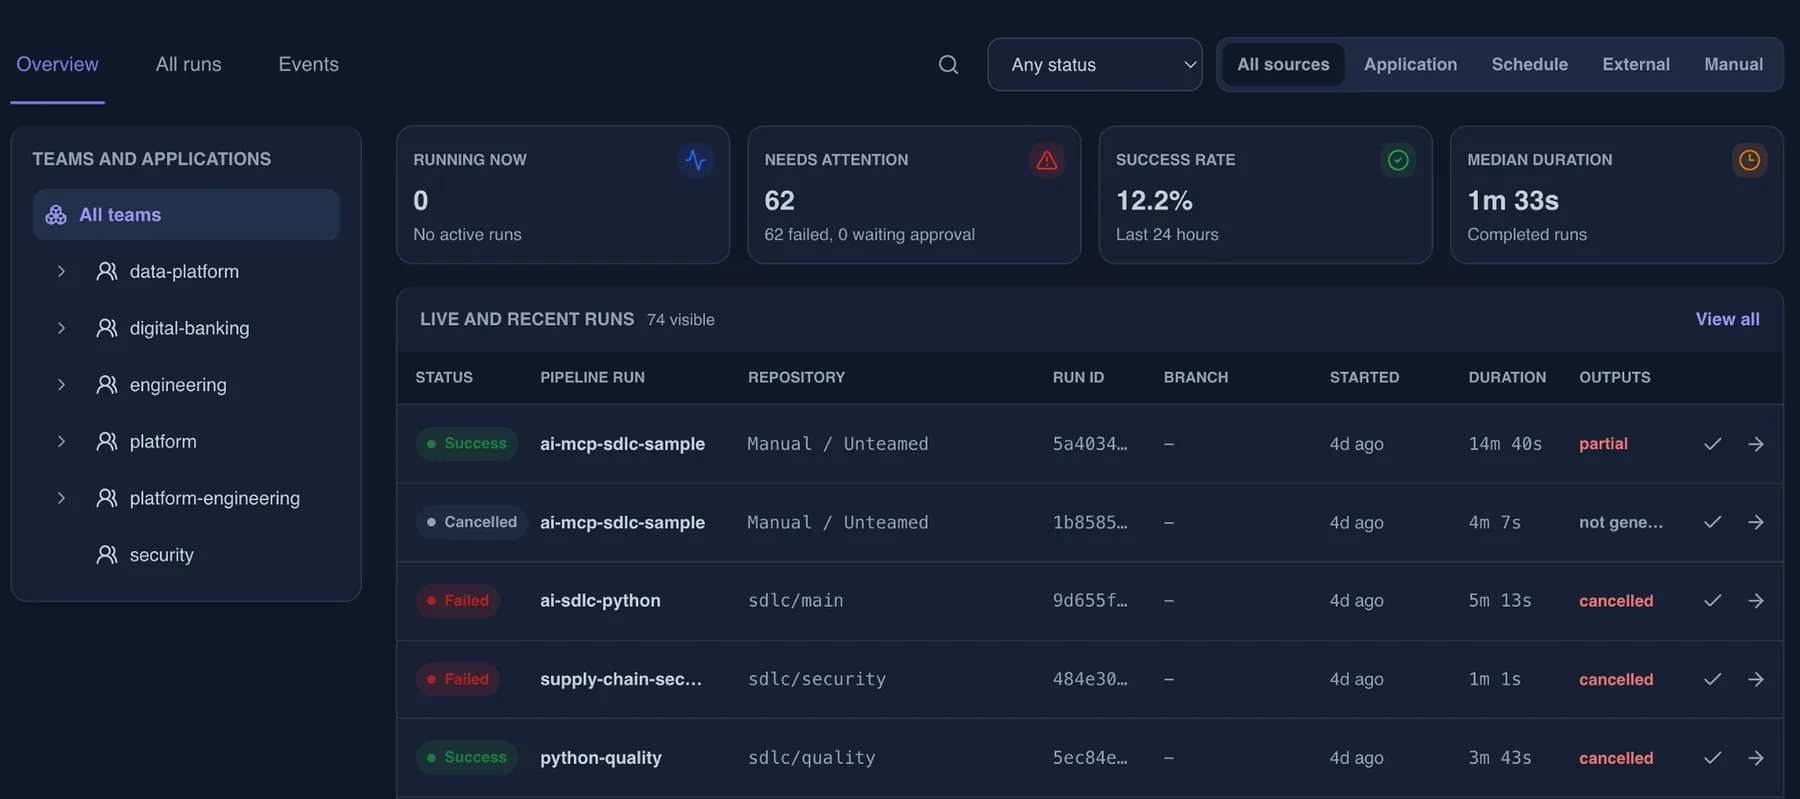
NopsAI stores durable pipeline evidence and exposes platform health through bounded logs and Prometheus metrics. Monitoring views relate execution behavior to the workflow, runner, trigger, schedule, model and output.
Evidence and monitoring, end to end.
The flow stays explicit enough for operators to inspect, secure, automate and improve.
Capture run evidence
Persist normalized trigger data, authorization context, task and step transitions, logs, approvals, knowledge snapshots and outputs.
Collect platform signals
Read allow-listed Docker or Kubernetes service logs and expose Prometheus metrics from existing service owners.
Analyze operating behavior
Aggregate run, pipeline, step, task, trigger, schedule, model, runner, reliability, efficiency and security views.
Drive follow-up
Save monitoring views, evaluate alert rules and track recommendations through acknowledgement and resolution.
What teams can standardize.
These are current NopsAI platform primitives, not a future-state feature list.
Durable execution history
Inspect run status, task history, logs, child runs, approvals, resolved context and deliverables together.
System logs
Stream bounded, redacted service logs through authenticated SSE with reconnect and cursor behavior.
Operational analytics
Compare pipeline, step, task, trigger, schedule, runner, reliability, efficiency and security behavior.
AI and output audit
Track model usage plus final-output generation, contract correction, rendering and persisted file state.
Declared once, reviewed like code.
The example is declarative and Git-reviewable. Runtime behavior still passes through live AAA, credential, compatibility, execution and monitoring boundaries.
enabled: true
routes:
  - name: production failures
    enabled: true
    recipients:
      include:
        teams:
          - platform/prod
        users:
          - [email protected]
    events:
      failure: true
      approval_requested: true
      approval_rejected: true
      cancelled: true
    filters:
      pipelines:
        include:
          - platform/release/*
      branches:
        include:
          - main
          - release/*
    delivery:
      channels:
        - mail
      throttle:
        dedupe_window: 10m
        max_per_run: 5
Configuration stays inside the governance model.
Content-free stream audit
Access to system log streams is audited without copying streamed log content into the audit record.
Least-privilege providers
Docker uses a restricted socket proxy and Kubernetes uses label-selected, read-only pod log permissions.
Redaction and limits
Log sources, line size, buffers, cursors and sensitive patterns are bounded by the system-log owner.
GitOps-aware operations
Monitoring definitions and notification routes can be represented as reviewable platform configuration.
Continue through the operating model.
01 · Workflow orchestration
Combine scripts, LLM goals, approvals, reusable steps and child pipelines without splitting the operating model.
02 · GitOps configuration
Manage pipelines, scopes, access, knowledge, profiles, triggers and runtime defaults as versioned configuration.
03 · Governance and AAA
Apply default-deny access decisions before configuration reads, tool use, secret resolution, approvals and dispatch.
Bring a real evidence and monitoring workflow.
We can map the configuration, authorization, runtime and evidence boundaries against your current platform model.